
Before we go into the available Nagios alternatives, let’s speak about Nagios itself, what its finest features are, and why it’s become such a popular program. We’ll then look at the tool’s disadvantages and why someone would wish to replace it with an alternate option. After that, we’ll go over network monitoring in general. We’ll look at how most tools handle it by utilizing the Simple Network Management Protocol. Finally, we’ll be ready for the big reveal, as well as a look at some of the finest Nagios alternatives for network monitoring.
What Exactly Is Nagios?
Nagios XI is a network monitoring program that lets you monitor your network using a web-based user interface with a configurable dashboard. With Nagios XI, you may use configuration wizards to add additional devices, servers, apps, and services to monitor. For example, you may use the autodiscovery wizard to automatically find new devices or monitor an Exchange server.
Features:
- Dashboard customization
- Configuration wizards
- Autodiscovery
- Notifications for User Management
- User management
You may establish several user accounts for your team using user management. You may assign various roles to each member of your team and define security settings that determine what activities they can do. You may, for example, specify whether they can see objects, operate or configure hosts and services, access advanced capabilities, or use the monitoring engine.
The platform also has an alarm system. You may configure email and SMS notifications to let you know about changes in your environment, such as when the status of a host changes. Notification escalation allows you to arrange for notifications to be redirected to additional users if a particular number of them go unanswered. Nagios XI is suggested for businesses that demand a solution with extensive visualization possibilities. The Standard Edition costs $1,995 (£1,405).
What’s the Deal With Nagios?
The title of this post may prompt many readers to ask what might be wrong with Nagios to warrant replacing it with another program. Actually, there’s nothing wrong with Nagios in and of itself. It’s been there for about two decades and is still going strong. However, just because there is nothing wrong with Nagios does not imply that there are no other fantastic products available that you should examine. If you’re still looking for a monitoring platform and have heard about Nagios, you might be curious about your other nagios alternatives.
Reasons to Think About Nagios Alternatives
There are several constraints connected with the basic Nagios framework, some of which may or may not be overcome by third-party add-ons. There’s the unfriendly GUI; the lack of database and performance records; configuration issues; and the absence of automated device detection.
While a third-party add-on can help in some circumstances, there’s a lot to be said for a comprehensive, unified monitoring system that doesn’t rely on third-party add-ons to offer greatness. With so many Nagios plugins and add-ons available, it can be difficult to keep Nagios up to-date and working in a dynamic environment.
However, certain drawbacks cannot be remedied by add-ons, such as the fact that Nagios does not differentiate between device types such as servers, switches, and routers. Furthermore, some administrators and engineers prefer to use Windows Server rather than the Linux/Unix commands associated with Nagios.
As software development progresses and applications become more user-friendly, network administrators seeking an update may wish to explore a Nagios alternative. But where to begin? This list has been designed to help you navigate through all of the top Nagios alternatives available.
The Most Effective Nagios Alternatives
A fast Google or other search engine search can provide dozens of network monitoring programs. Some are for sale, while others are free and open source. Our list of the best Nagios alternatives includes largely premium solutions because they frequently have a more robust feature set. All of the commercial tools on our list offer a free trial version that is either time- or capability-limited, allowing you to try any of them. However, because some of these tools require significant work to set up effectively, you may want to avoid attempting too many.
#1. ManageEngine OpManager
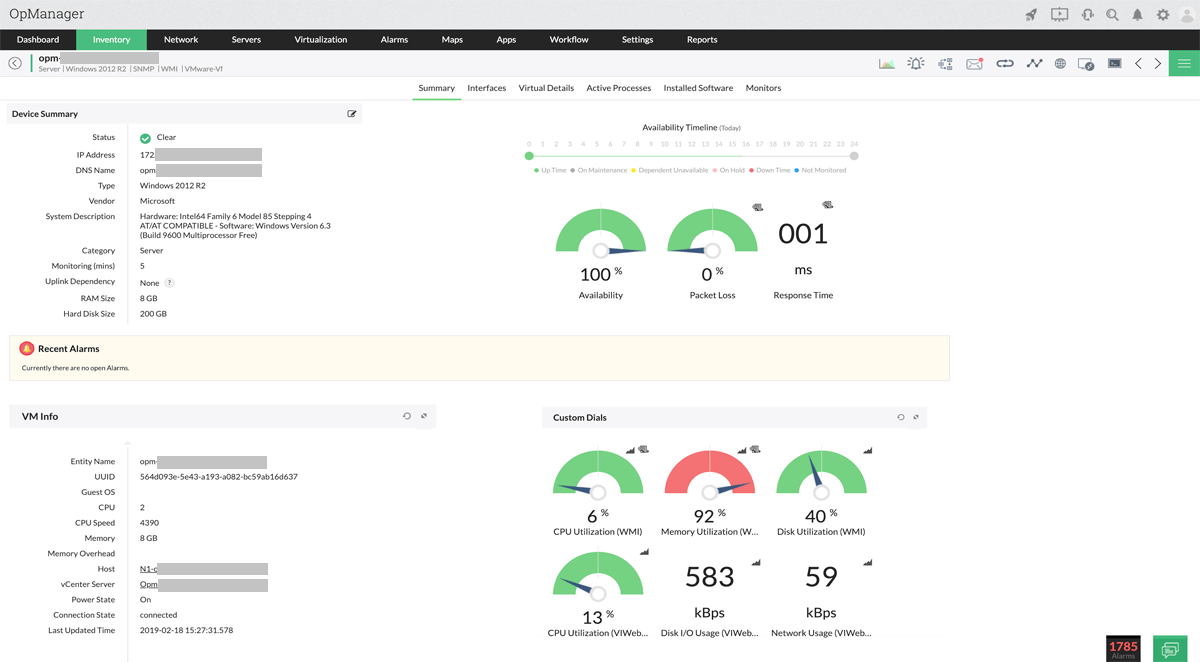
ManageEngine OpManager is a network monitor that provides server, real-time network, and virtualization monitoring. With ManageEngine OpManager, you can construct personalised dashboards to monitor your environment with over 200 performance widgets. There is also a network mapping option that generates network maps that show how your devices link to one another.
Features:
- A dashboard that can be customised
- Autodiscovery
- Network diagrams
- SMS and email notifications
- Alarm escalation procedures
The programme is straightforward to configure and comes with an automatic network discovery tool. The network discovery tool allows you to schedule network discovery so that the platform discovers new devices on a regular basis. You may also use the discovery rule engine to define the post-discovery actions that will be executed, such as adding a newly discovered device to a network map.
Email and SMS notifications keep you informed about changes to your environment. You may create alerts using threshold-based trigger conditions so that you receive notifications when a device’s metrics fall over or below a given point. You may also create alarm escalation criteria so that unanswered alerts are sent to a human for examination after an hour.
ManageEngine OpManager is a tempting product for enterprises that are searching for a tool to monitor physical and virtual resources cost-effectively. Ten devices start at $245 (£172). Available for Windows and Linux.
#2. DATADOG
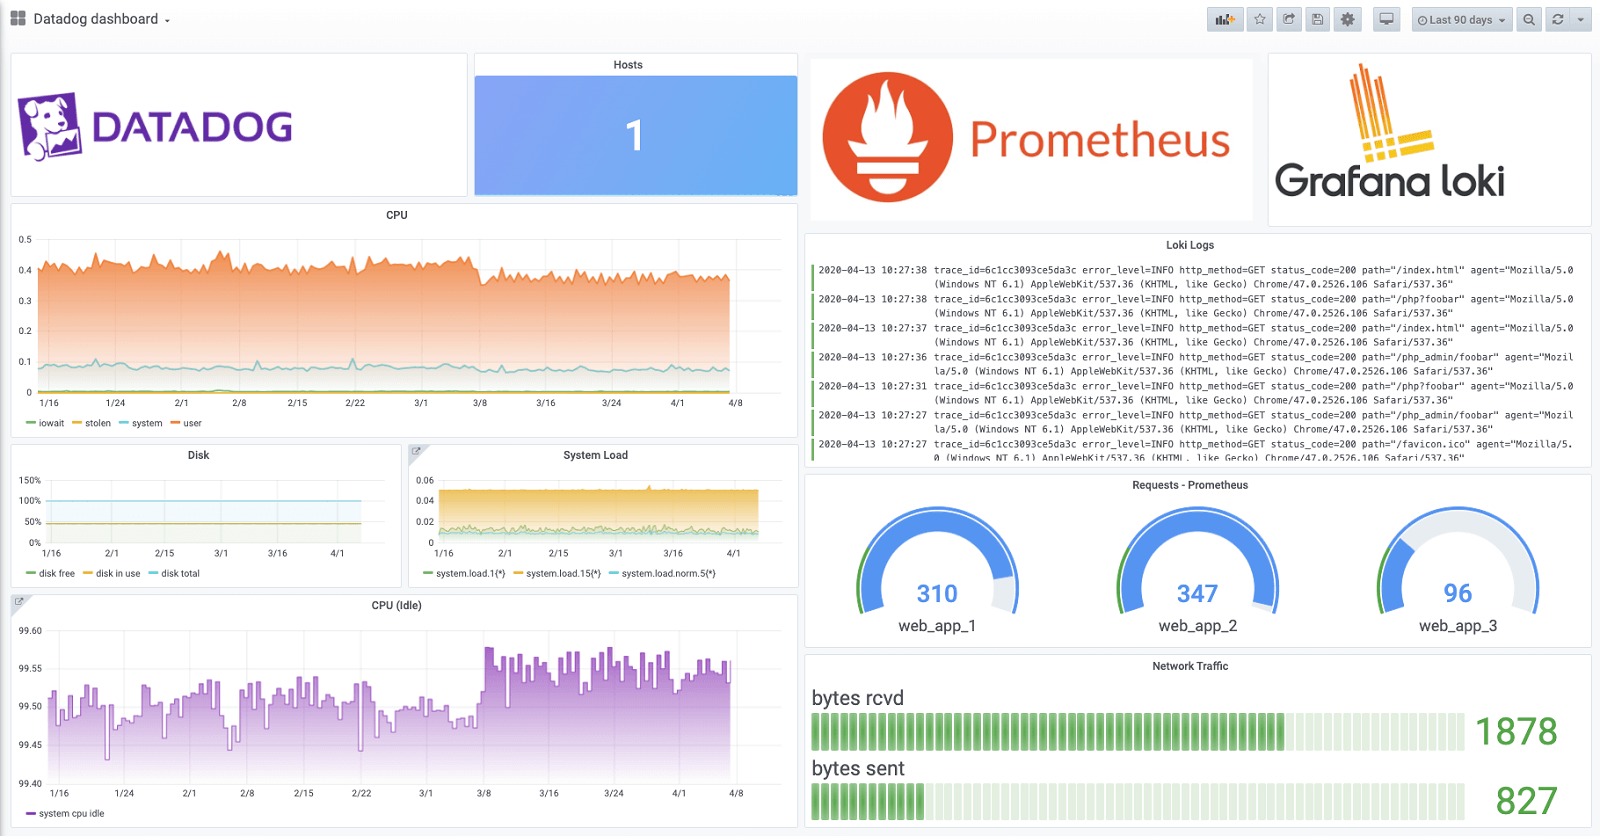
Datadog is a network monitoring tool that monitors networks, applications, services, and the cloud. With Datadog, you can automatically gather logs from services and apps with over 600 out-of-the-box connections, so you can retain visibility over your whole network and analyse it from a single spot. The search and filtering options make it much easier to discover the performance data that is most relevant to your situation.
Features:
- Collect service and application logs automatically.
- Logs may be searched and filtered.
- Dashboard that can be customised
- Notifications for Full API Access
The user interface is fully customizable, with a customised dashboard where you can monitor real-time performance statistics and see data by host device or any tag of your choice. You may also leverage the platform’s complete API access to construct new integrations that can harvest metrics from other programmes that you rely on every day.
You may also set the programme to send email, PagerDuty, Slack, and other notifications. As you reply to a notice, you may define trigger conditions using the platform’s alerting logic and discover who has replied to alerts before you.
Datadog is intended for businesses that wish to monitor many apps from a single platform. Available for Linux, Mac OS, and Windows The price begins at $15 (£10.57) per host each month. There is also a free version that supports up to 5 hosts and has a metric retention of one day.
#3. PAESSLER PRTG NETWORK MONITOR
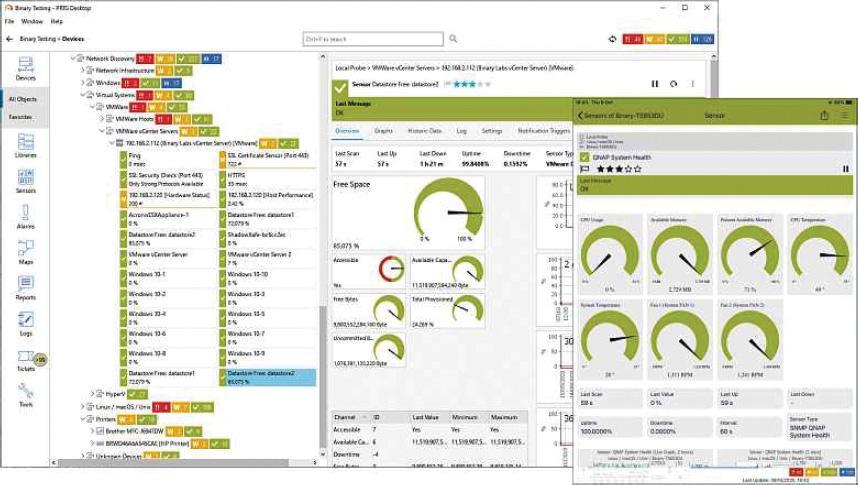
Paessler PRTG Network Monitor is network monitoring software that monitors the network, SNMP, server, cloud, and applications. With Paessler PRTG Network Monitor, you can monitor your network via a configurable real-time dashboard or a network map. The map creator on the site allows you to create maps with over 300 distinct map components, which you can then share with others through a URL link.
Features:
- SNMP monitoring
- Application monitoring
- Cloud monitoring
- Diagram of a network
- Customized notifications
- Reports
You may generate reports to audit particular parts of your infrastructure and export the results as a PDF, HTML, XML, or CSV file. Run reports on demand or build up a plan for reports to be issued on a regular basis.
The platform also has a highly customizable alarm system. You may configure trigger conditions to inform you when a sensor’s status changes or when its value exceeds a specified threshold. Email, push notification (Android and iOS), Slack message, Syslog message, Microsoft Teams message, and more methods are available for alerts. You may also build your own integrations using the PRTG API.
One of the most cost-effective and effective nagios alternatives is Paessler PRTG Network Monitor. Costs start at $1,750 (£1,233) per server. There is also a free version that allows you to monitor your network with up to 100 sensors. A 30-day free trial is available.
#4. Checkmk
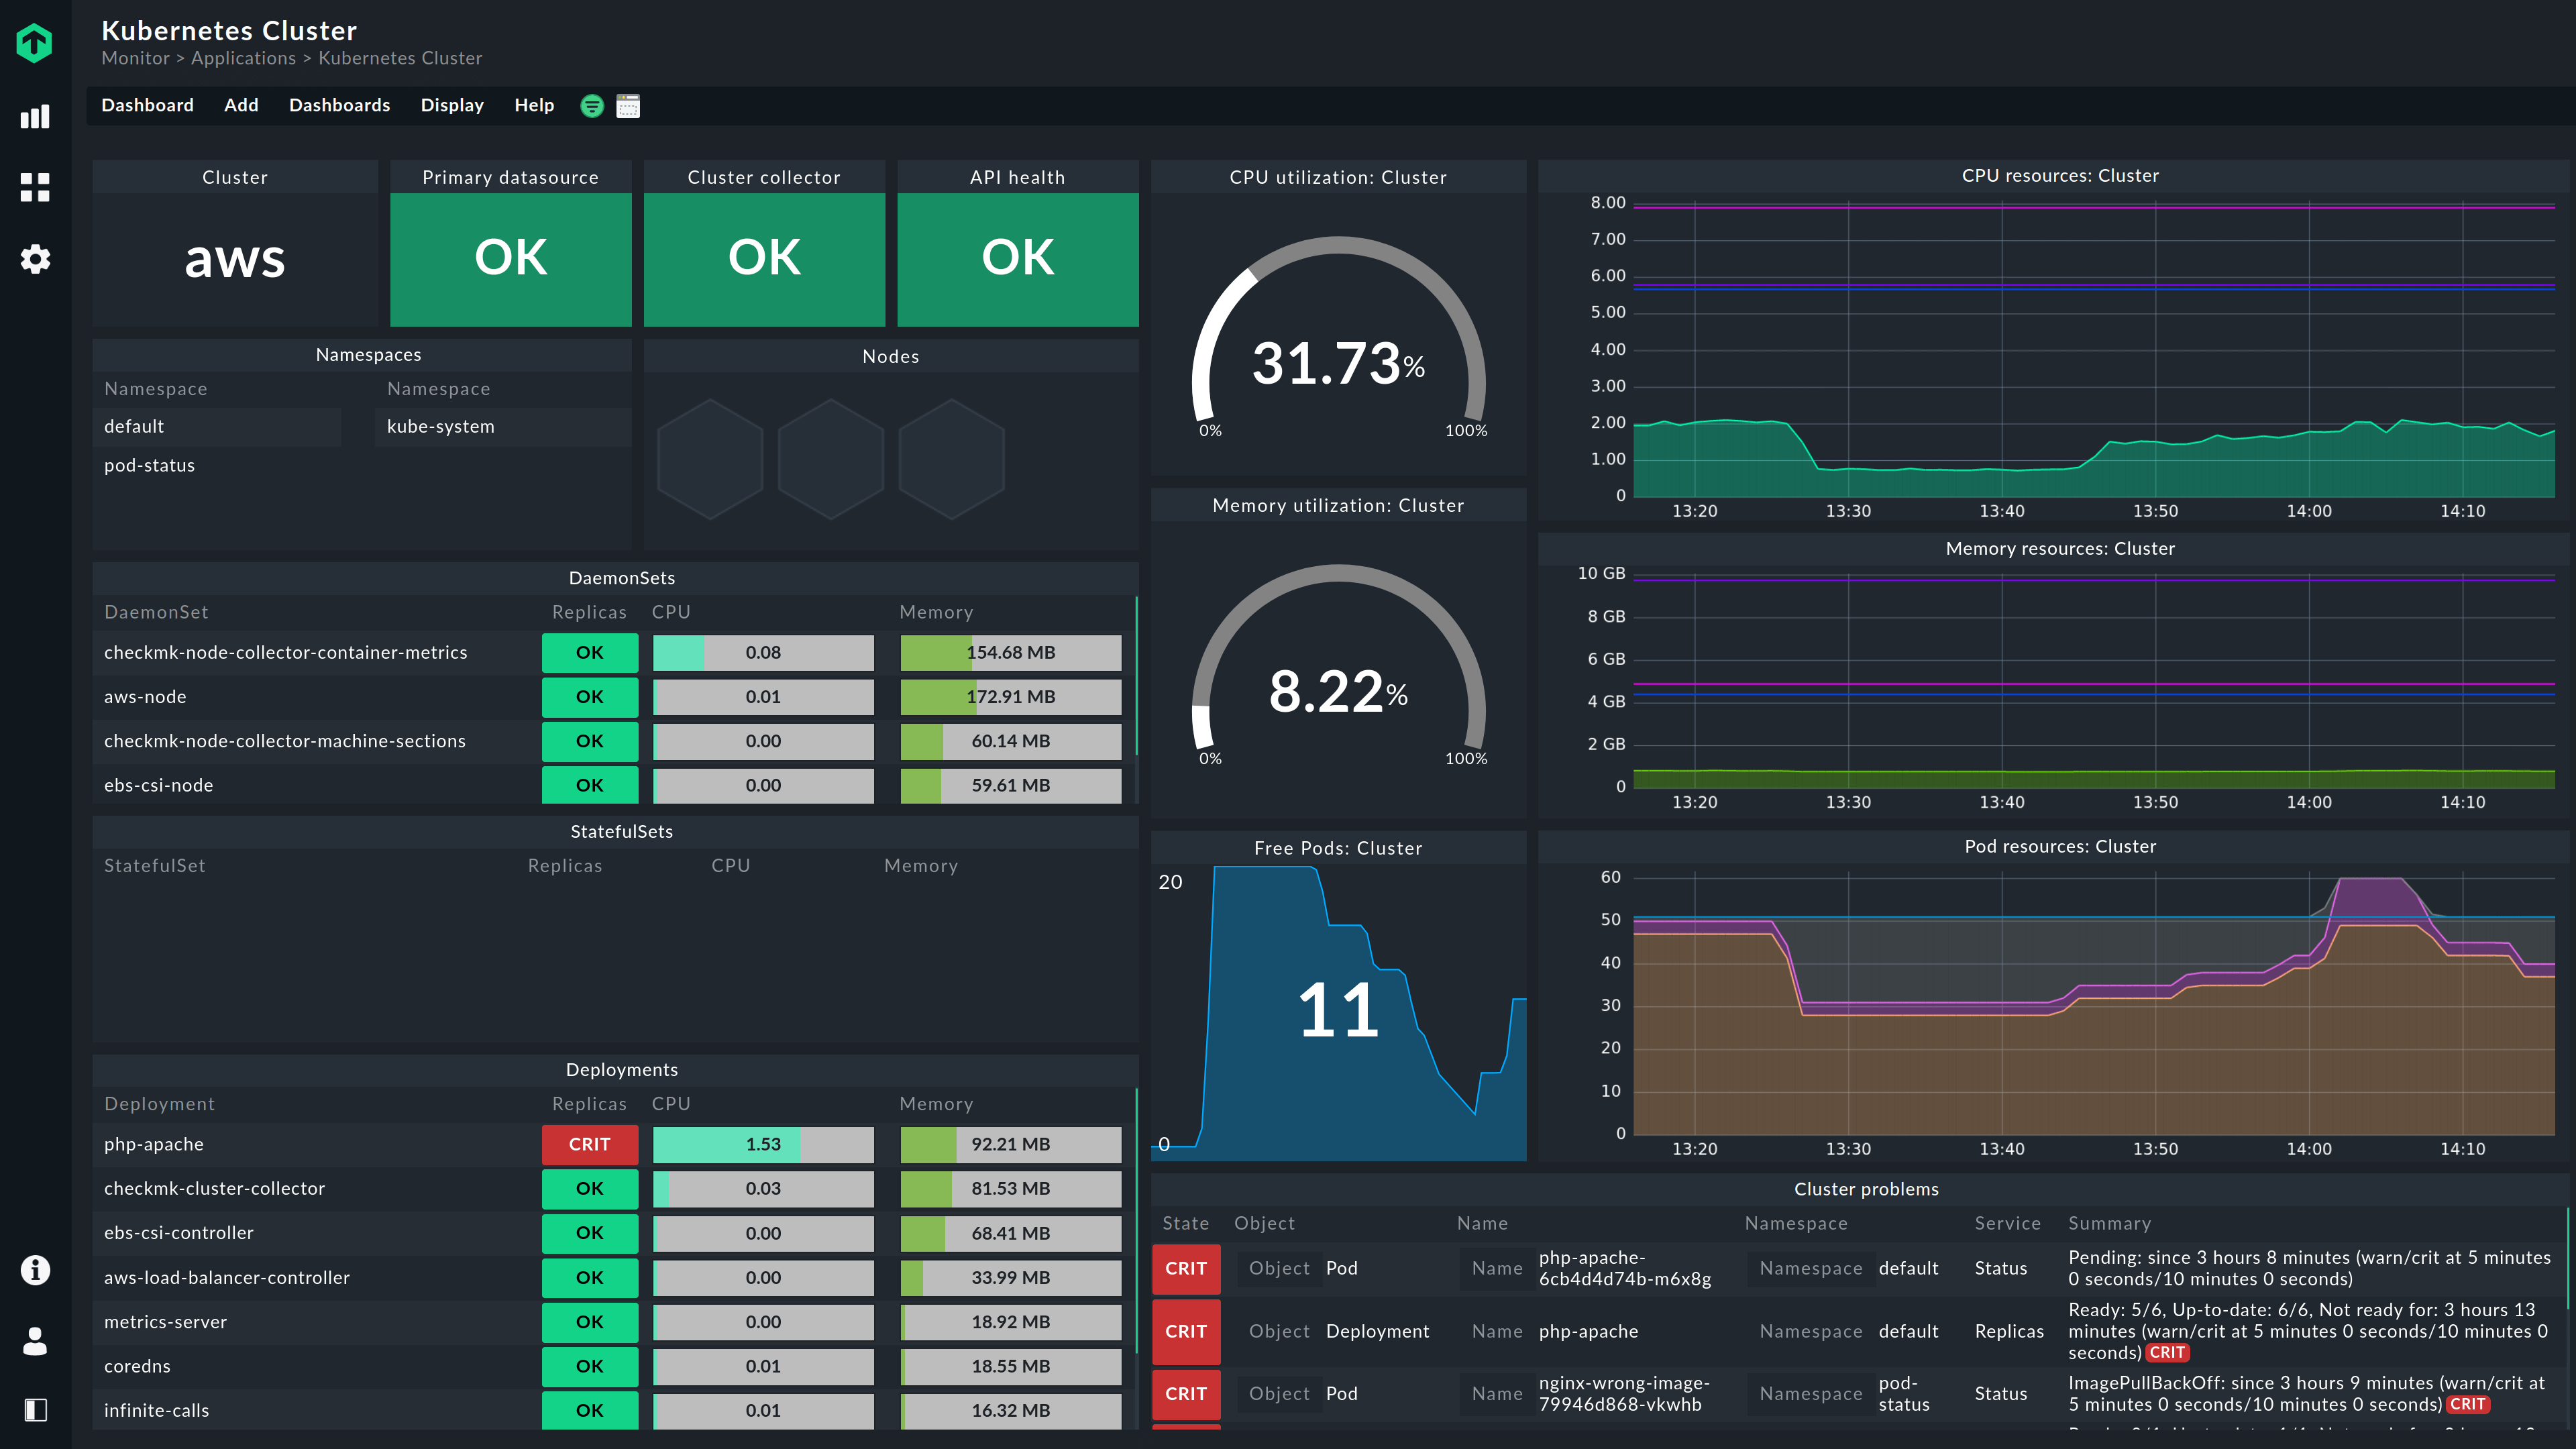
Checkmk is a major solution for IT infrastructure and application monitoring. It monitors the health of IT infrastructure, such as networks, servers, applications, storage, cloud infrastructure, IoT devices, and even business processes, using an agentless and agent-based approach.
Features:
- monitors networks, servers, and applications
- Server monitoring on-premises and in the cloud
- There is a free version available.
- Checkmk combines the following forms of IT infrastructure monitoring:
- Monitoring is based on status, which tracks the health of a device or application.
- Time-series graphs can be recorded and analysed using metric-based monitoring.
- log-based and event-based monitoring, in which significant events may be filtered out and actions can be performed depending on those occurrences.
The CheckMK server can only be deployed on a Linux computer. To get the programme up and running, all you need is a basic understanding of Linux. Checkmk can alternatively be executed as a virtual appliance, a physical appliance, or a Docker container. The agents used by Checkmk to monitor and gather data are supported on Windows and other operating systems. CheckMK comes in a variety of editions. Before you begin installing it, you must first determine which of the editions you wish to use.
The Free Standard Edition has all of the features of the Standard Edition and is free for the first 30 days. Both the Free Standard Edition and the Raw Edition may be simply upgraded to the Standard Edition.
#5. SolarWinds NPM
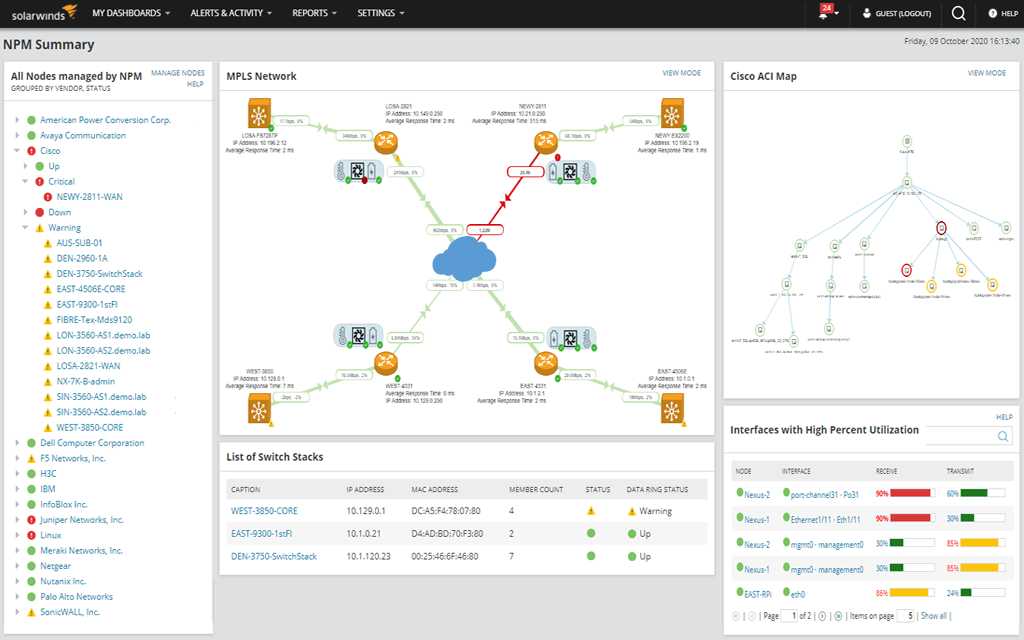
if you are looking for the best Nagios alternatives then you have to try this one. SolarWinds Network Performance Monitor (NPM) is a robust network monitoring solution that assists enterprises in detecting, diagnosing, and resolving network performance issues. The tool is best suited for medium- to large-scale businesses.
Features:
- Network monitoring with many vendors
- Network Insights for Greater Discovery and Visibility
- Intelligent network topology mapping using NetPath and PerfStack for simple troubleshooting
- Asset inventory that is constantly being updated
- Advanced alerting
Crucial path visualization The SolarWinds Orion platform is required to deploy NPM in the cloud or on-premises. The Orion Platform is the foundation of all SolarWinds IT solutions, allowing the NPM to function and interact with other SolarWinds tools and applications.
The SolarWinds NPM license is dependent on the number of objects to monitor or the greatest number of network components monitored.
#6. Icinga
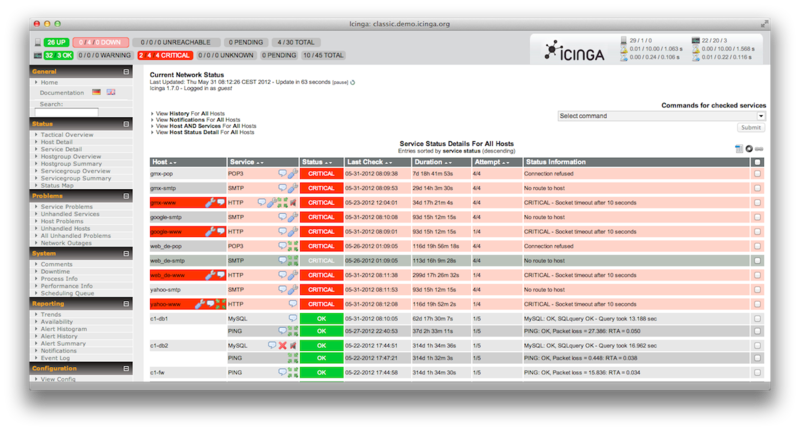
Icinga is a popular enterprise-grade open-source solution for IT infrastructure and application monitoring. It examines the availability of your network resources, alerts you of outages, and creates performance statistics for reporting. Icinga was launched in 2009 as a clone of the Nagios Core programme. The objective is to build on Nagios’ foundation, including the development of additional features and capabilities.
Features:
- Monitoring of server components such as switches, routers, temperature and humidity sensors, and more
- Easy plug-in architecture allows users to simply create their own service tests. accepts Nagios plug-ins
- Monitoring of network protocols such as SMTP, POP3, HTTP, NNTP, ping, and more
- Monitoring of host resources such as CPU load, disc utilisation, and more
- Notification, visualisation, and reporting
- Free to use; paid professional support packages
- The programme is scalable, adaptable, and can monitor big networks across various locations.
Icinga consists of the following key products:
- Icinga 2 (the server) is the heart of the Icinga monitoring programme, which runs on Linux.
- Icinga Web 2—a web interface for users to check monitoring data and transmit instructions to the Icinga Core
- Icinga DB is a synchronisation daemon between Icinga 2 (Redis) and Icinga Web 2 (MySQL).
- Icinga Director—the configuration and deployment tool for Icinga 2
Icinga has been successfully implemented in large and sophisticated settings with hundreds of hosts and services, as well as in distributed and failover configurations.
#7. NetXMS
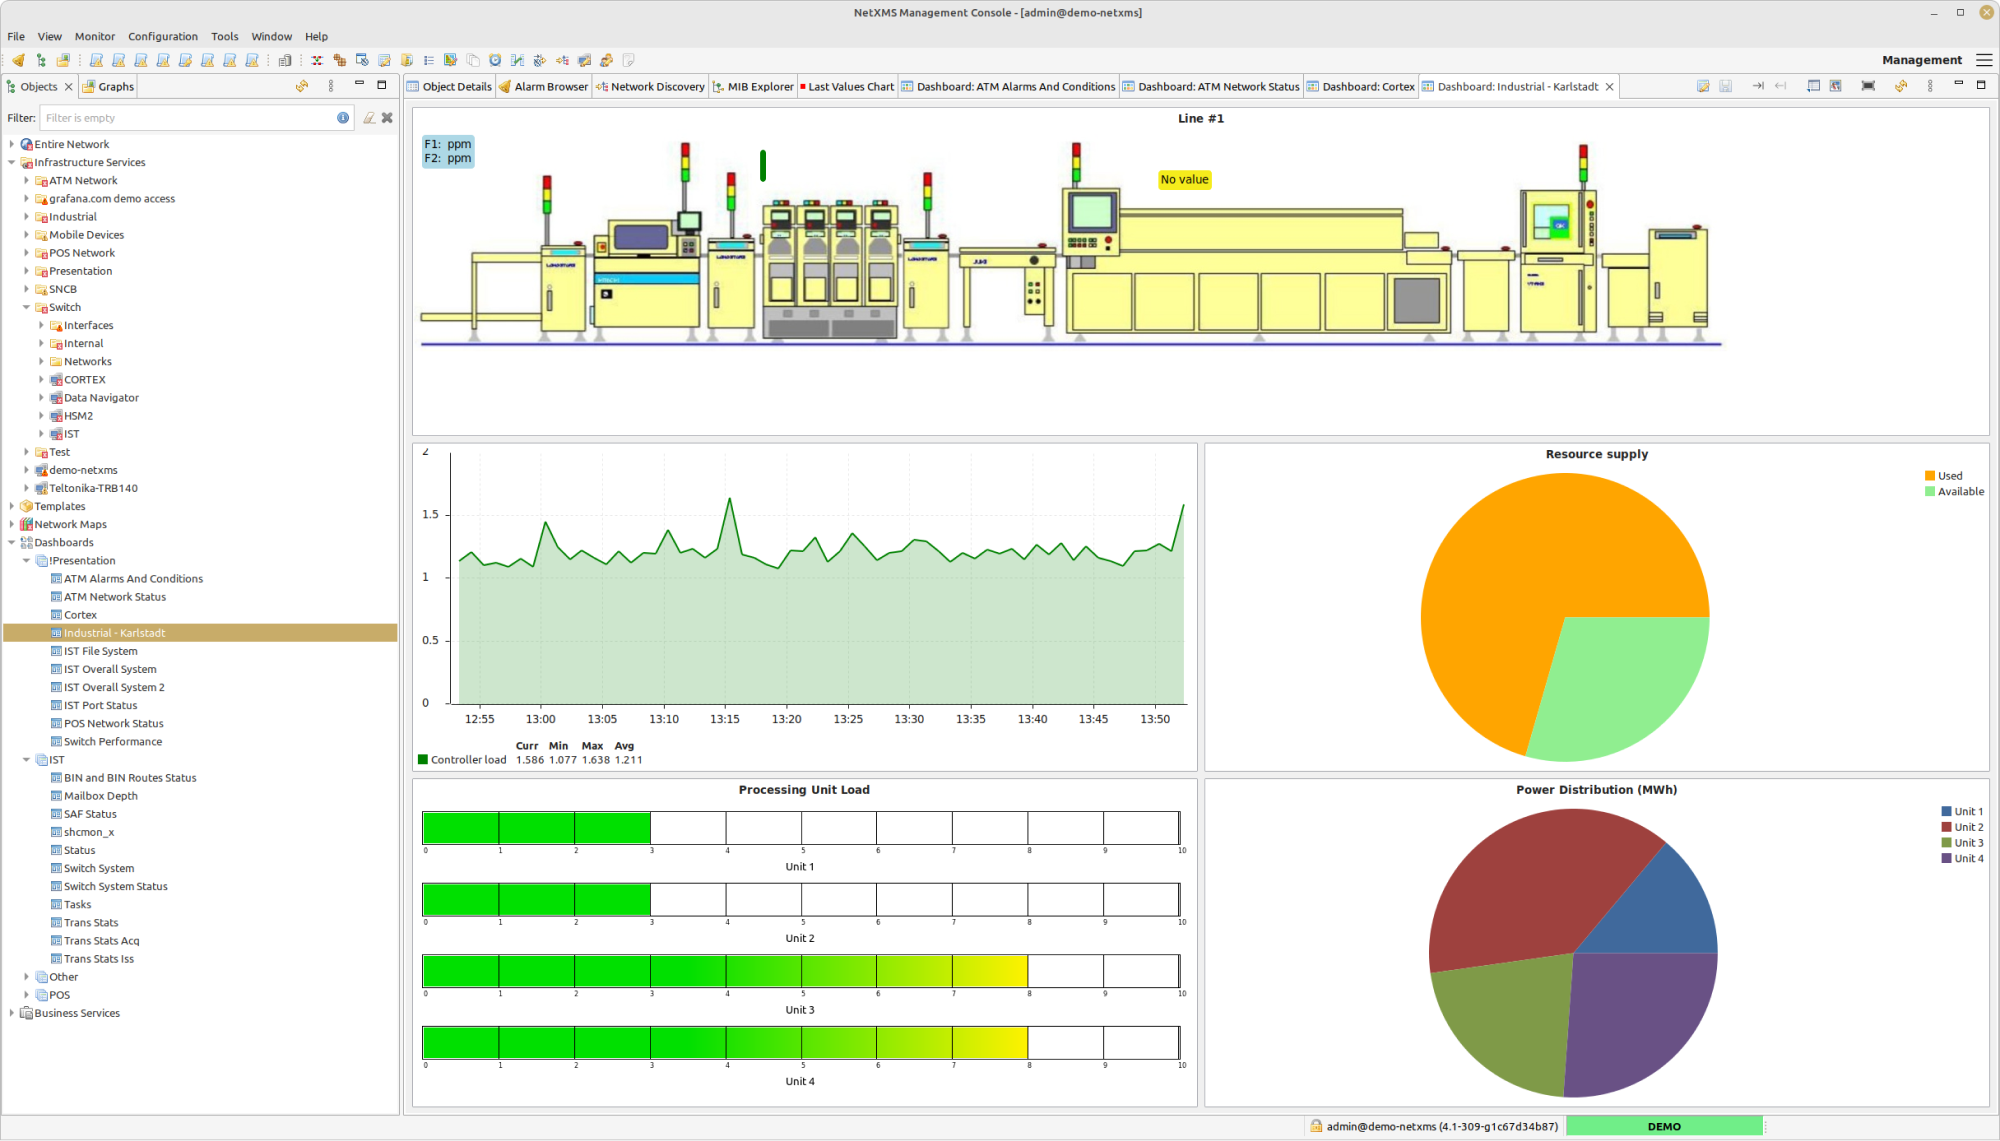
NetXMS is an enterprise-grade, multi-platform, open-source network management and monitoring tool. NetXMS works natively on both Windows and Linux/Unix-based operating systems and may be used to monitor your whole IT infrastructure, including servers and apps.
Some of the important characteristics and capabilities include:
- Plug-in compatibility with Nagios (most Nagios plug-ins work out-of-the-box with NetXMS)
- Network device, server, and application monitoring from a single management server can monitor distant locations.
- Data gathering from SNMP-capable systems or native NetXMS agents
- Consolidated configuration, upgrades, and utilisation of relatively few system resources
- GUI administration consoles for Windows and Unix that are easy to use
- Automatic network discovery for OSI layers 2 and 3
- The capacity to send emails and SMS alerts
NetXMS can automatically discover devices in your network and gather data from them using agents. The information gathered is returned to the NetXMS servers for processing and storage. Network administrators can view gathered data through a desktop, online, or mobile (Android) management panel.
#8. DYNATRACE
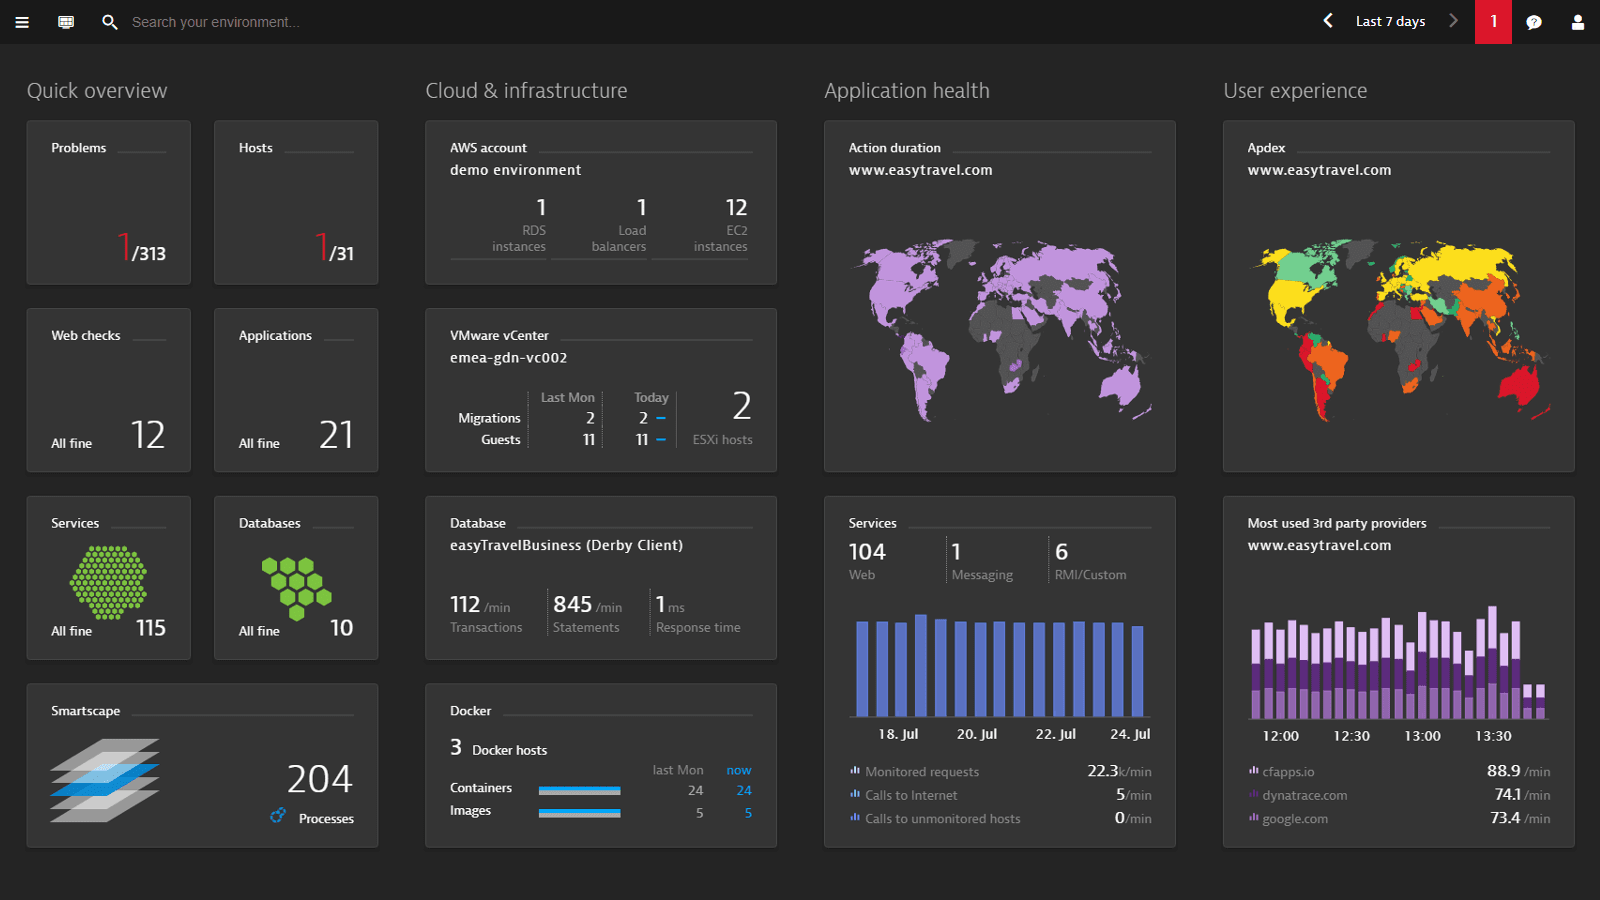
Dynatrace is a tool for monitoring infrastructure and application performance that allows you to monitor network devices, services, and applications. Using Dynatrace, you can automatically find hosts, programmes, and dependencies and display them as part of a topological map. An end-to-end view of your whole application stack is provided by the map.
Features:
- Autodiscover hosts
- Dependence diagram
- Finding anomalies
- Alerts
- Analysis of the business effect
AI-driven anomaly detection detects unexpected network activity and warns you with root-cause analysis so you can solve the issue that caused the problem. For example, AI may detect installations that violate SLAs and roll them back. This decreases the amount of time spent on manual incident management and accelerates the resolution of performance issues.
The AI also provides business impact analysis, which analyses transactions from apps and reports the precise number of real users affected by an active performance issue. Understanding the real-time impact on users and customers helps you decide which issues to address first.
For businesses that demand a cutting-edge application monitoring tool, Dynatrace is one of the best nagios alternatives. The infrastructure monitoring package costs $21 (£14.79) per month per host, and the full-stack monitoring version costs $69 (£48.62) per month per host. Needs a 64-bit Linux distribution as a dedicated host.
#9. Atera
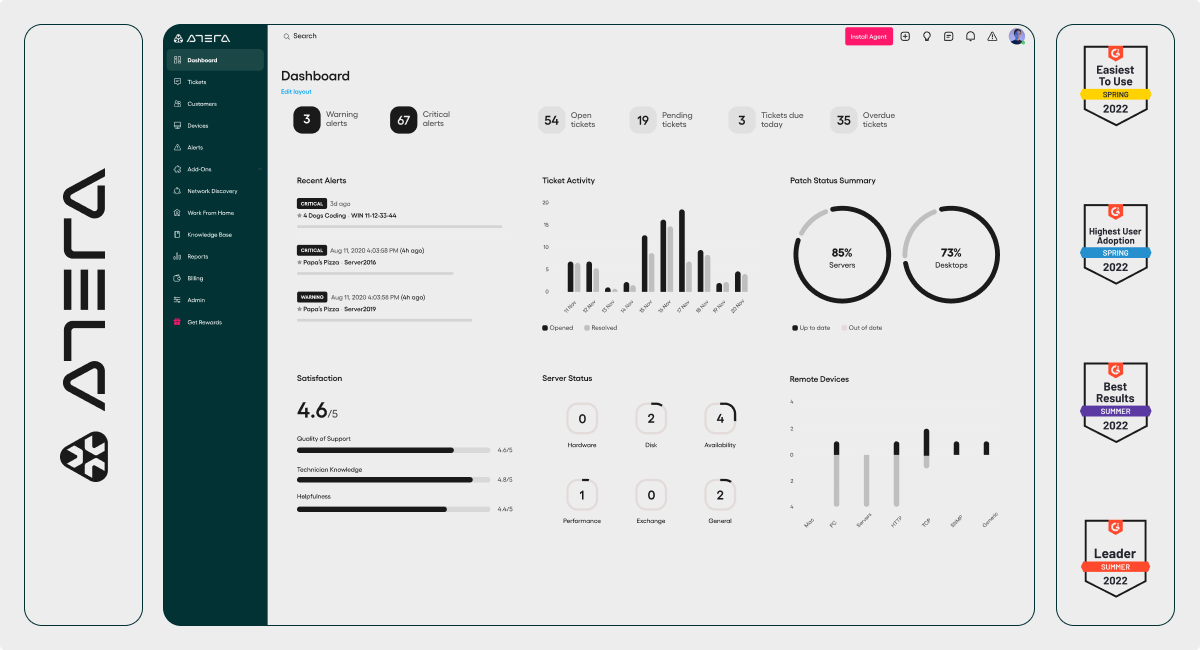
Another one of the best nagios alternatives is Atera a suite of technologies that offers a managed service provider (MSP) all of the tools required to run a client support company. This comprises both tools for technicians and company management systems, such as a help desk ticketing system and support staff management services.
Features:
- Suitable for managed service providers
- automation of tasks
- Performance warnings
- System administration duties
Atera’s Remote Monitoring and Management (RMM) package offers all of the capabilities required to control a system remotely. This comprises network, server, and application monitors. The package also includes various system administration functions, such as patch management.
At the core of the RMM is an alerting system. This establishes acceptable performance criteria for a variety of system activity metrics. If one of those criteria is exceeded, the system sends an alarm. MSP technicians do not need to sit and watch the monitoring console all of the time since they are aware that they will be brought back to the dashboard if an issue develops. The criteria are established at levels that provide technicians with adequate information to take action and detect any obvious performance impact.
The capabilities integrated into the RMM software enable one technician to be accountable for numerous client systems concurrently. MSP managers may monitor delivery performance by configuring the monitoring package to work in tandem with the service level agreements associated with their contracts. The system also counts the time that operators spend working for each client site, which makes billing a lot easier.
The Atera system is available in three different plans and with additional services. One of them is an automated network finding and mapping service. Integrations that interface with third-party technologies can be added to the Atera system.
#10. APPDYNAMICS
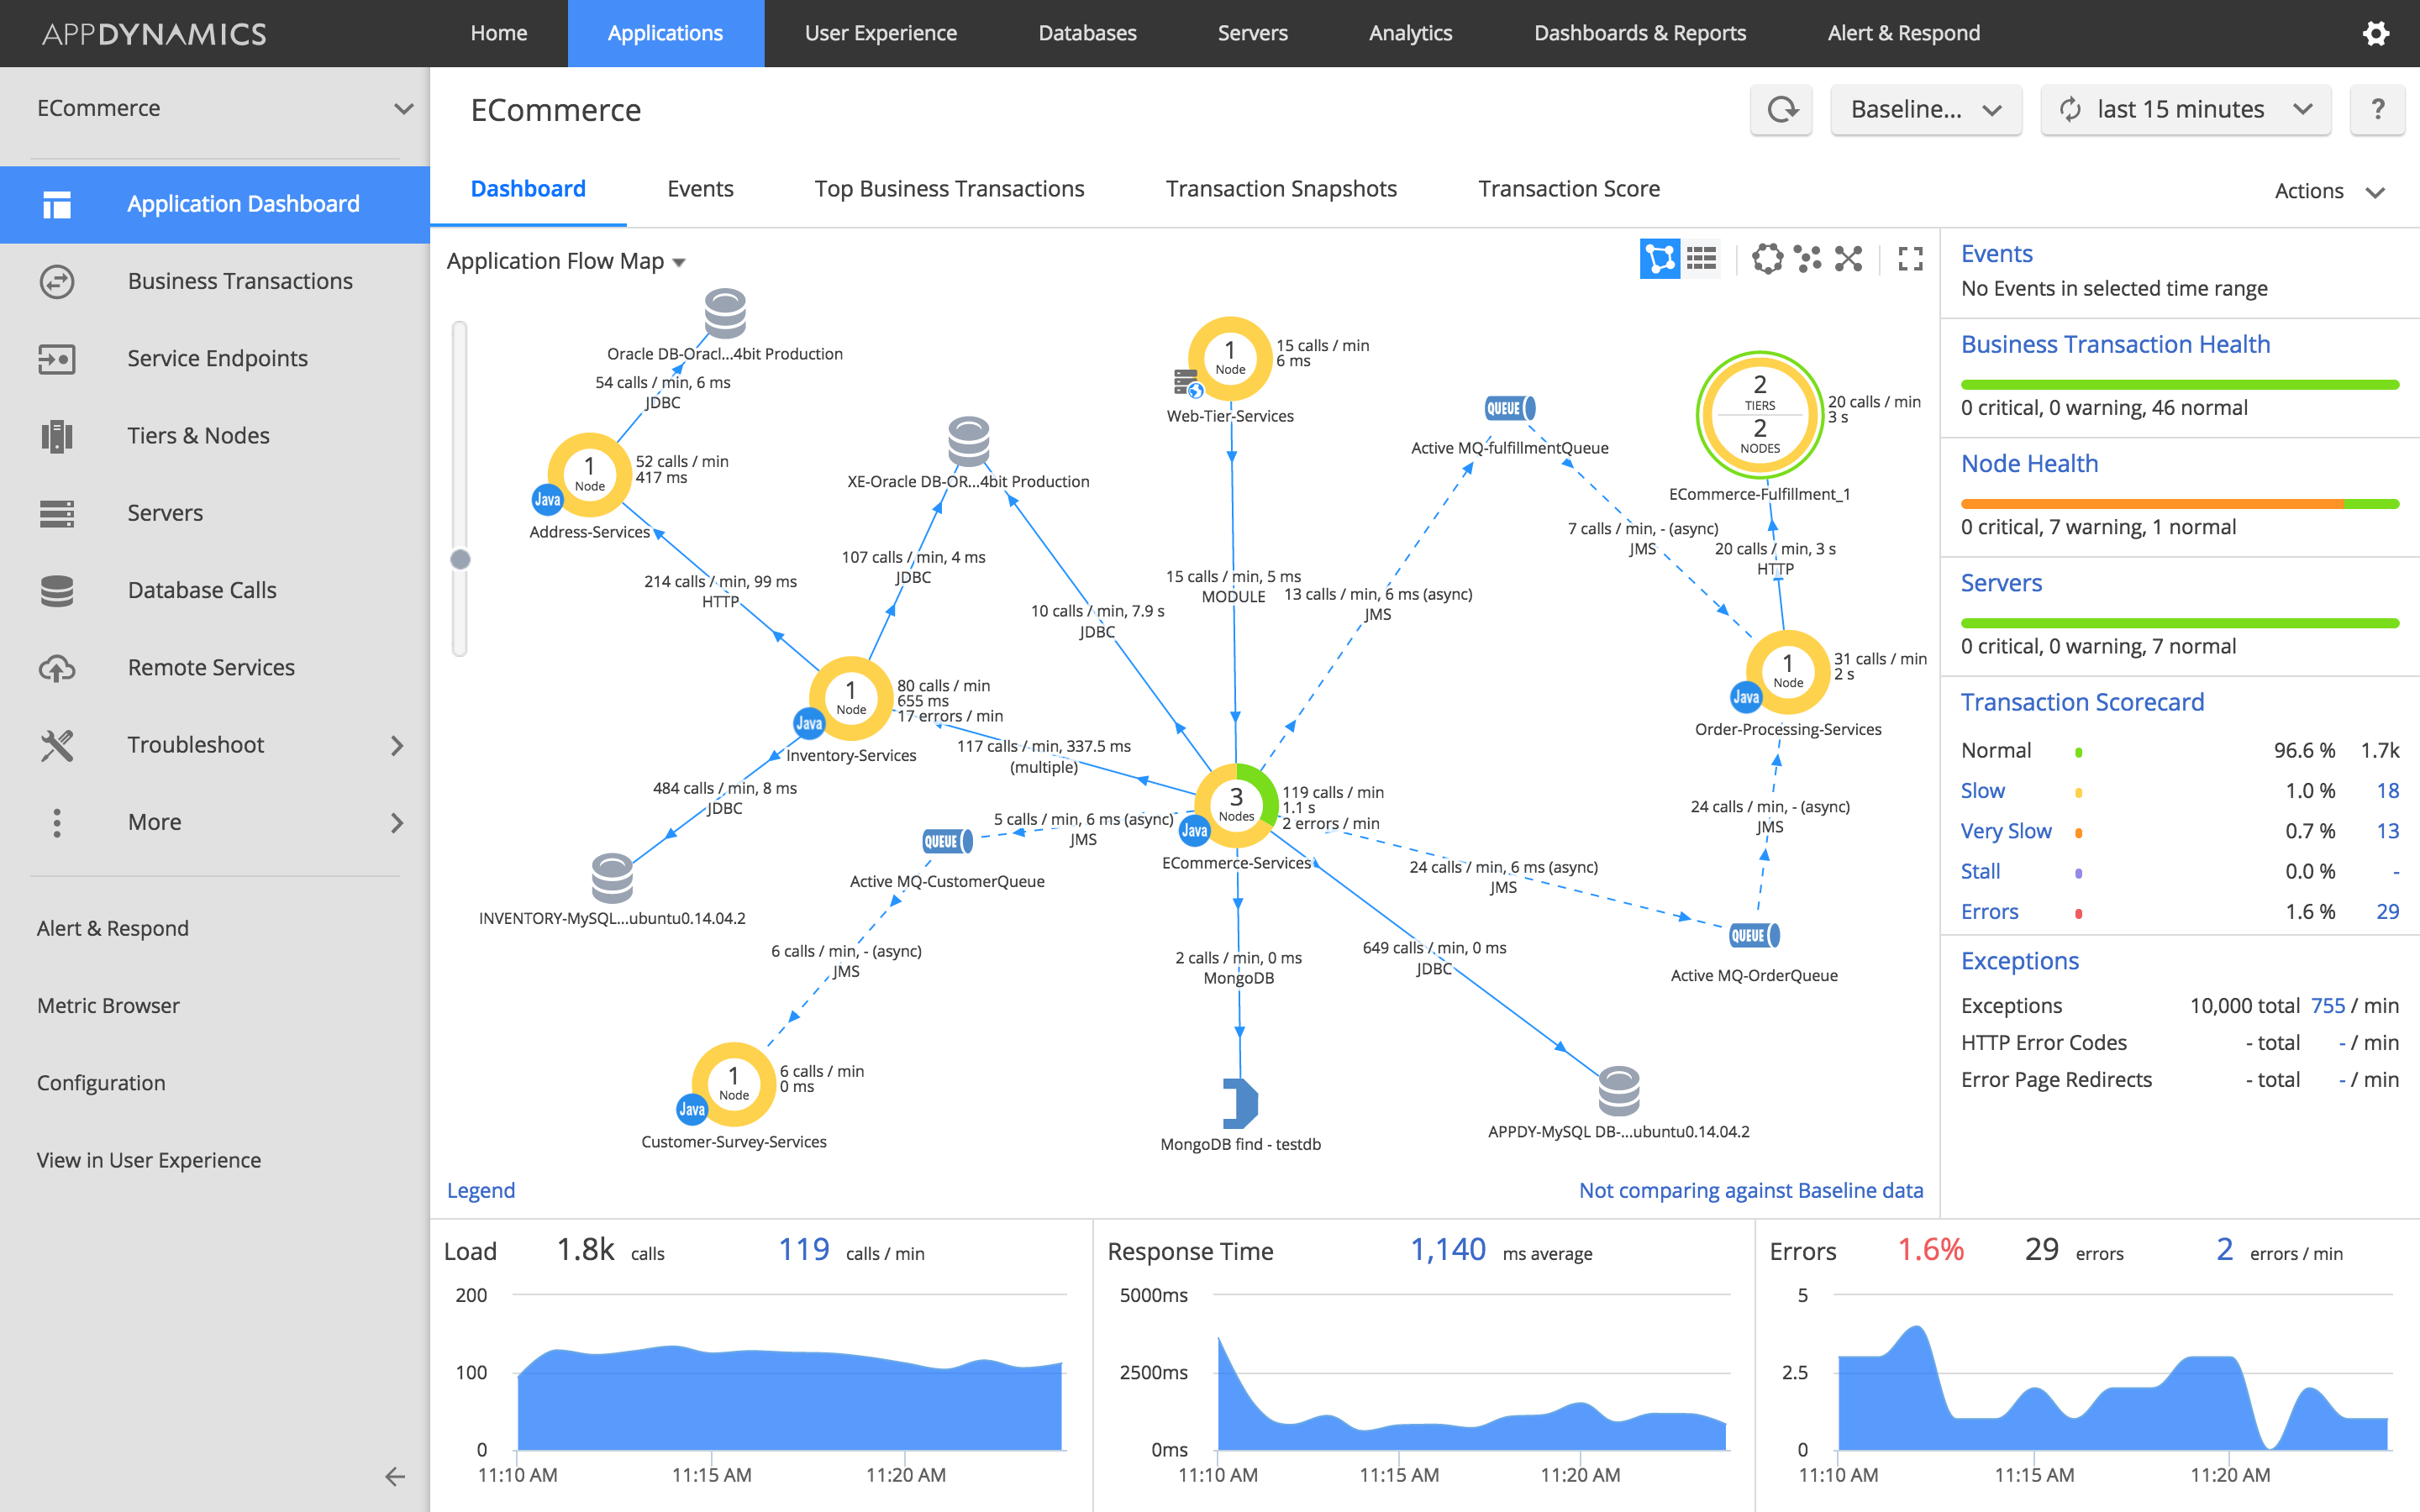
AppDynamics is an application performance monitoring system. A hybrid cloud environment’s apps and microservices may be monitored in real-time using AppDynamics. Metrics may be collected from a variety of services, such as Amazon Web Services, Azure App Services, IIS, Google Compute Engine, Java, Kubernetes, MySQL, NGINX, and others.
Features:
- Application monitoring
- Finding anomalies
- Integrations
- Dependency diagrams
- Autodiscovery
An autodiscovery feature recognizes traffic requests and generates a topology map to visualise their performance. Dependency mapping provides users with a detailed perspective of the dependencies in their network and aids in the discovery of new solutions to remedy bad performance.
The programme also contains anomaly detection, which may automatically discover performance problems in your network and provide you with notifications. Anomaly detection works by studying the regular behaviour of applications, producing a baseline, and then giving an alarm when it deviates from that baseline by an amount that can’t be called a false positive.
AppDynamics is suggested for enterprises who wish to monitor application performance with anomaly detection. To obtain price information, you must first get a quotation from the company. Both Windows and Linux support it.
#11. LOGIC MONITOR
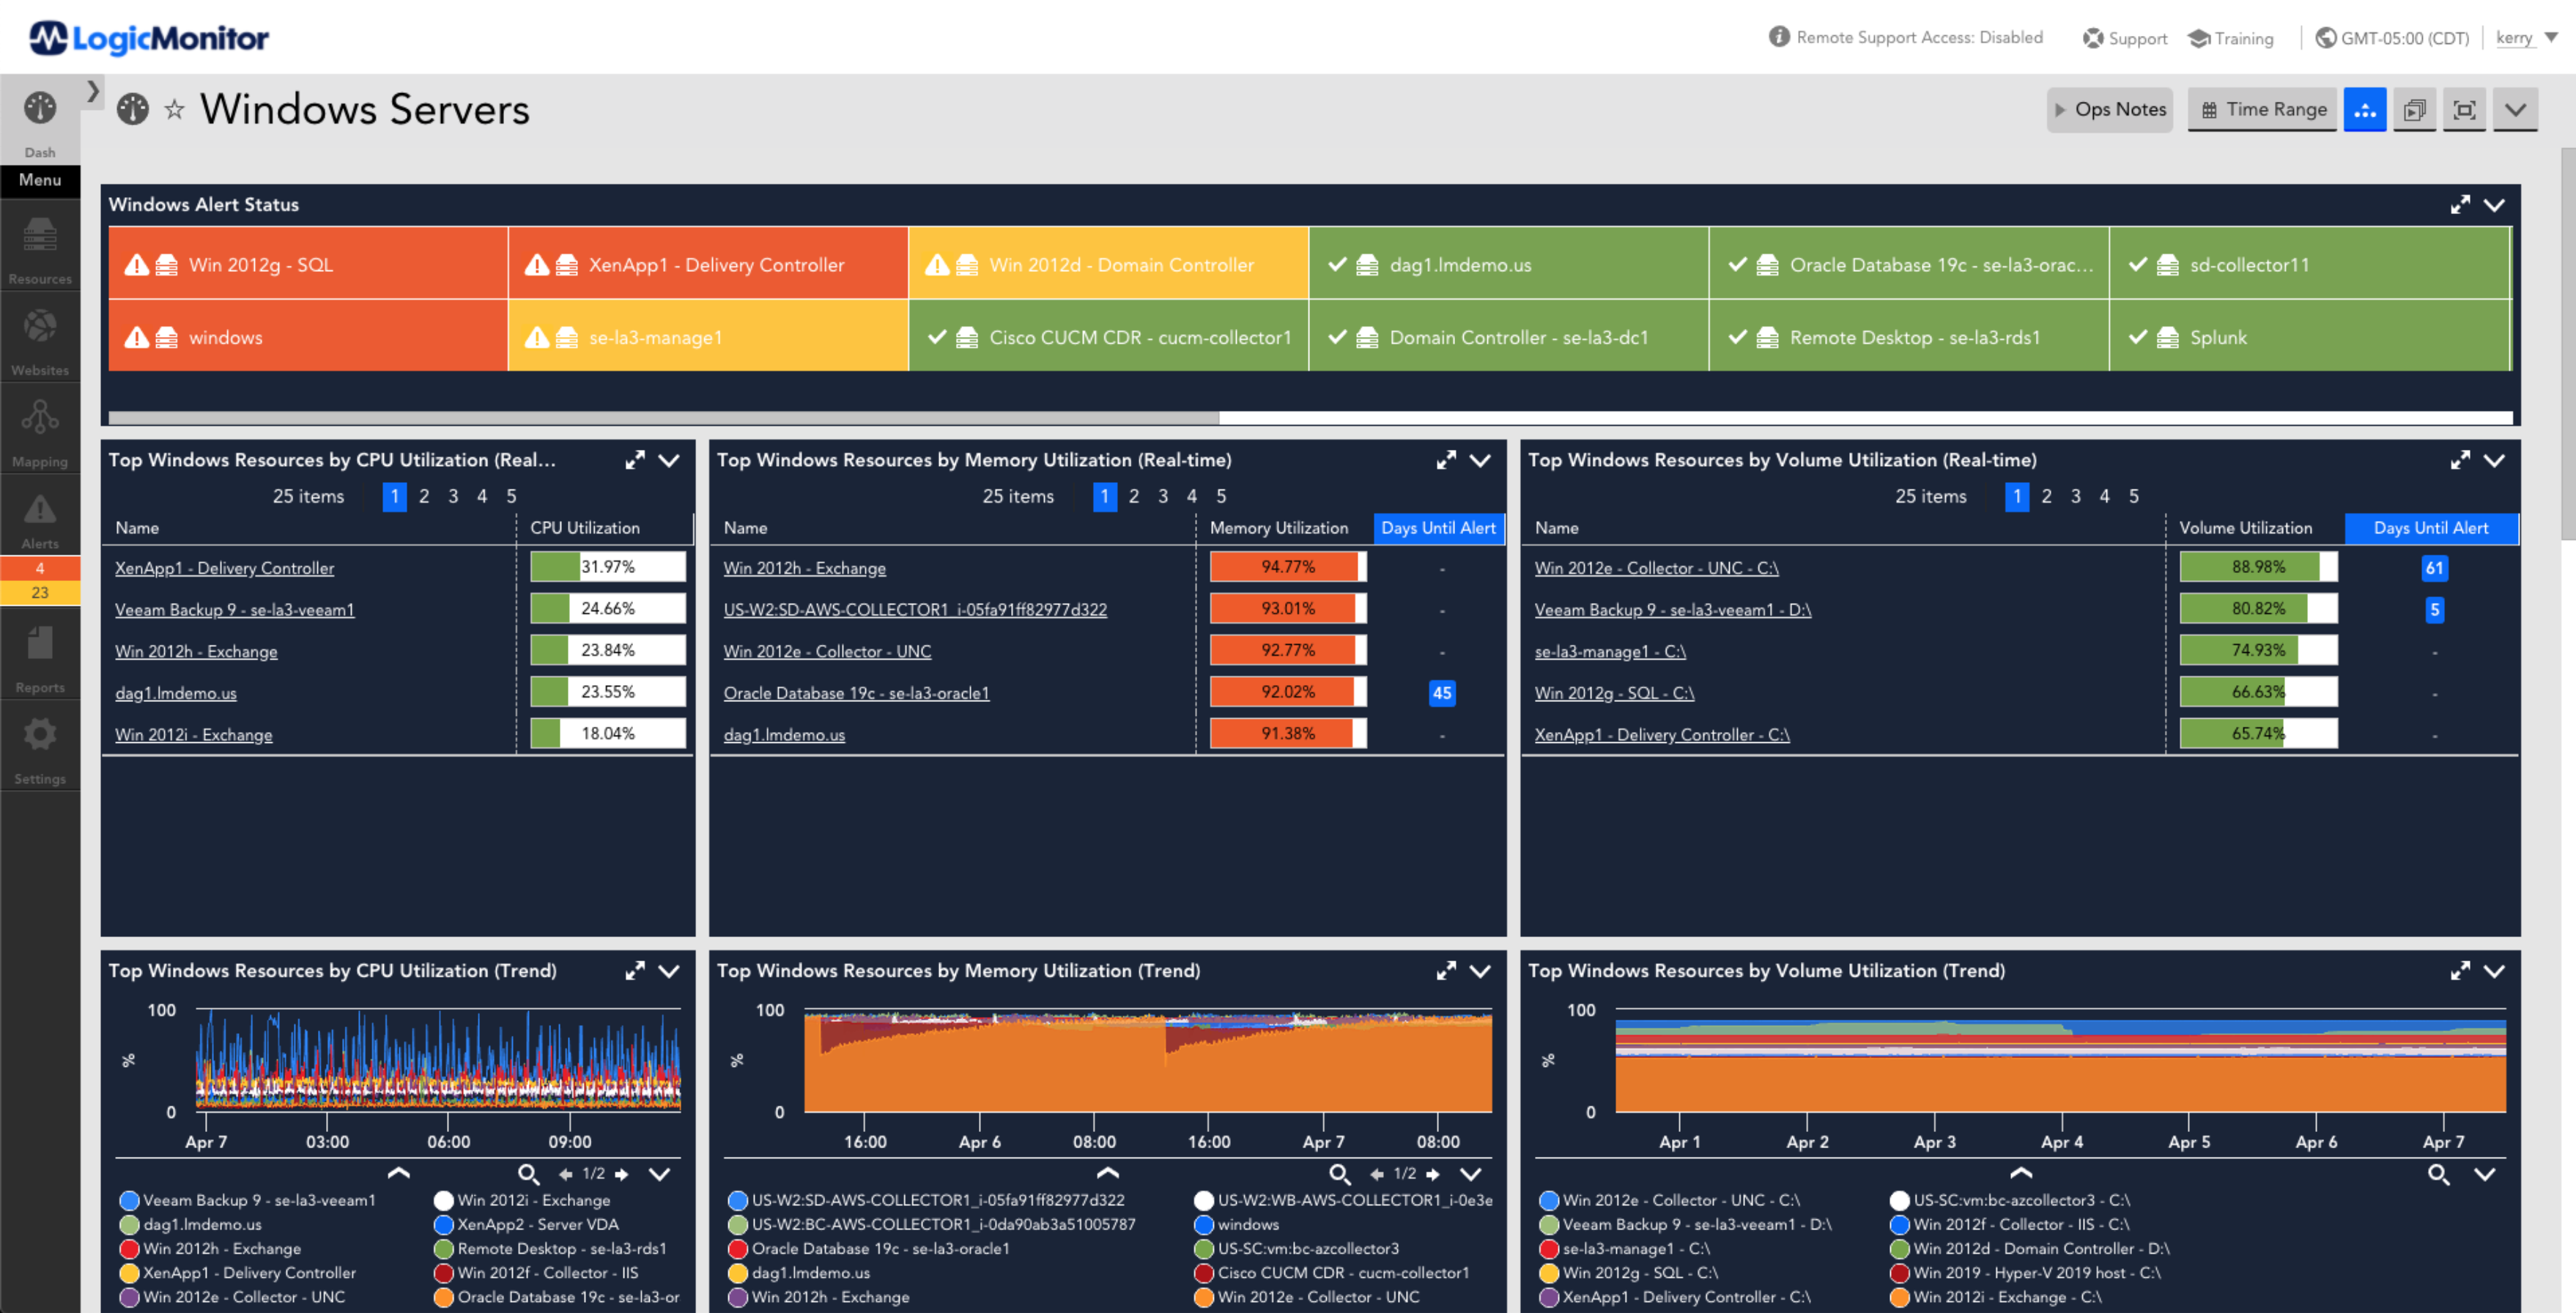
Another suitable Nagios alternatives is Logic Monitor a cloud-based infrastructure monitoring software with a customized dashboard that monitors device health, performance, resource use, and network usage. Logic Monitor includes over 2000 technology integrations, allowing it to collect metrics from a wide range of solutions, including databases and web applications.
Features:
- 2000+ technological integrations in a custom dashboard
- Autodiscovery
- Topology Maps
- Anomaly detection
Network autodiscovery automatically adds new devices to your monitoring environment, saving you time from manually adding them. Topology maps may also be used to view your surroundings from a geographical standpoint.
An AI solution enables the application to automatically detect performance problems and give root cause analysis to aid in debugging. The AI is proactive as well as reactive, projecting and detecting future performance patterns that you should be aware of.
Logic Monitor is an ideal option for businesses seeking an AI-driven monitoring experience with little human management. To obtain pricing information for this product, you must contact the company directly. Installing a collector requires Windows Server or Linux.
#12. Observium
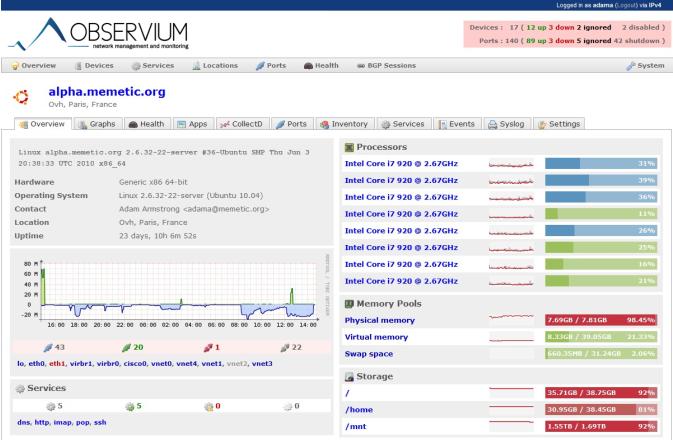
Observium is a robust, auto-discovering network monitoring tool that monitors networks and infrastructure in real-time. Observium is meant to operate on Linux, but it can also monitor Windows and other platforms, including Cisco, Juniper, FreeBSD, Citrix Netscaler, NetApp, and many more.
Some of the important characteristics and capabilities include:
- Support for numerous platforms and operating systems
- The ability to poll and retain measures for billing
- Simplify catastrophe recovery and capacity planning.
- Bypass standard round-robin constraints.
- Integration with the outside world and threshold alerts
- Auto-discovery and traffic accounting
- Network inventory and mapping: real- Realtime status monitoring
It employs SNMP to collect data, which is then presented via a nice web-based user interface. Because Apache and MySQL are required for Observium installation, your server must fulfil the hardware requirements to execute them.
Unlike other monitoring solutions, Observium is simple to install and configure. If you’re seeking suitable alternatives to nagios, Observium is a solid choice. Unlike nagios, Observium is significantly easier to set up and configure, despite having identical needs. Observium, on the other hand, does not run on Windows and does not provide data export.
#13. SUMO LOGIC

Sumo Logic is a log management and cloud monitoring application that gives you visibility into your network architecture. Sumo Logic provides real-time monitoring of cloud applications with over 150 integrations for services like AWS, Amazon EC2, Azure, GCP, Docker, PagerDuty, and MongoDB.
Features:
- 150+ Integrations for Log Management and Cloud Monitoring
- Analytics Notifications on a Bespoke Dashboard
The programme includes real-time analytics that may detect performance irregularities and put you in the path of malicious conduct throughout your network. The dashboard is fully customizable, giving you great control over your network viewpoint and the information you see.
Machine learning-powered notifications warn you when an issue in your network needs to be addressed. Sumo Logic provides you the ability to produce real-time email notifications when particular trigger conditions are satisfied.
If you’re searching for a low-cost cloud monitoring and log management application, Sumo Logic is worth checking into. The Essentials edition starts at $277 (£195.14). There is also a free version that supports up to 500 MB per day. Collector is compatible with Windows, Mac OS X, and Linux. if you are seeking nagios alternatives you should prefer this one also.
#14. OpenNMS
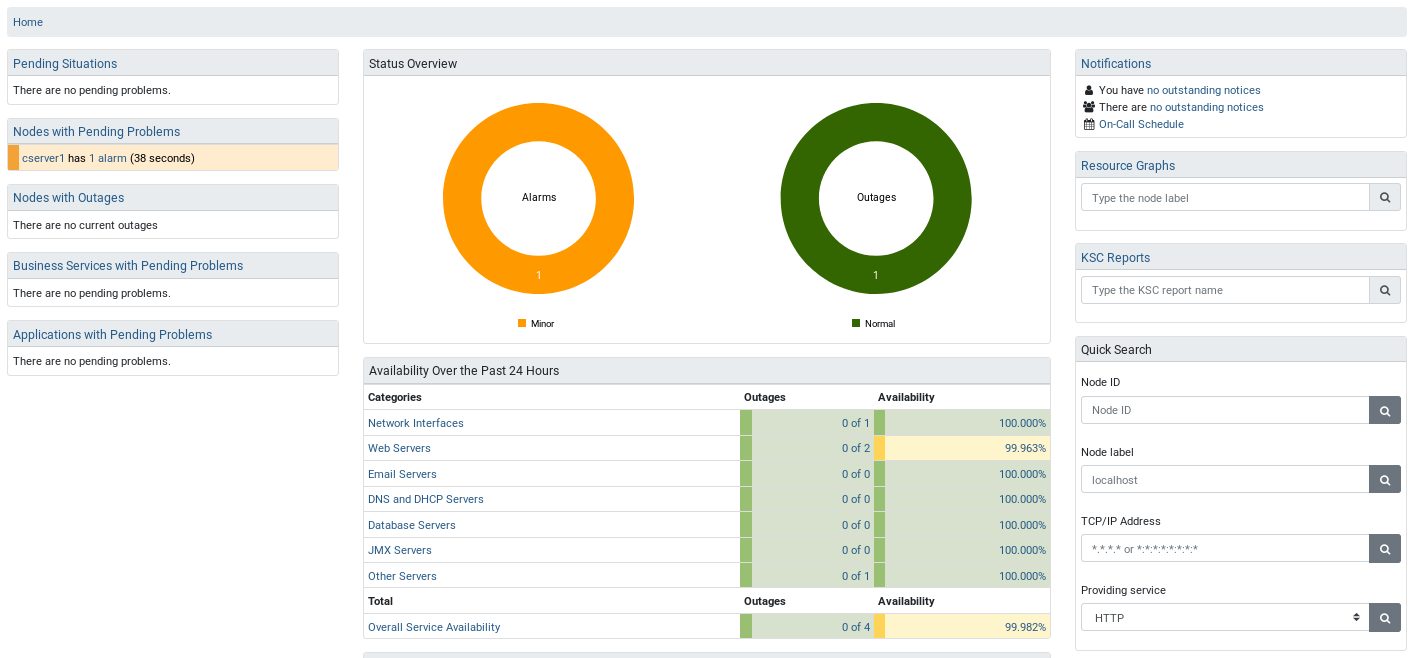
OpenNMS is an open-source network administration and monitoring programme created and administered by the OpenNMS Group and a developer community. There are no licencing restrictions for the product, which is completely free. It takes pride in being the first open-source enterprise-grade network management platform. The business plan is to supply it for free and generate money through consulting services supplied by the OpenNMS Group.
Features:
OpenNMS is meant to be flexible, scalable, and distributed, with the capability of managing tens of thousands of devices from a single server. OpenNMS works natively on both Windows and Linux/Unix-based operating systems as long as the Java SDK and PostgreSQL database are supported.
The four primary functional domains of OpenNMS are as follows:
- Discovery and Provisioning: discovers and adds devices to the management system either manually or automatically.
- Service monitoring determines the availability of network-based services such as ICMP, HTTP, and DNS.
- Notifications and Event Management—receives events via SNMP, syslog, and other ways and creates email, SMS, and other kinds of notification.
- Data collection: collects performance data for a variety of network protocols, including SNMP, HTTP, JMX, and WMI.


Add Comment